27 May 2026
Jet lag edges: mapping cross time zone effects on away team scoring in NBA contests
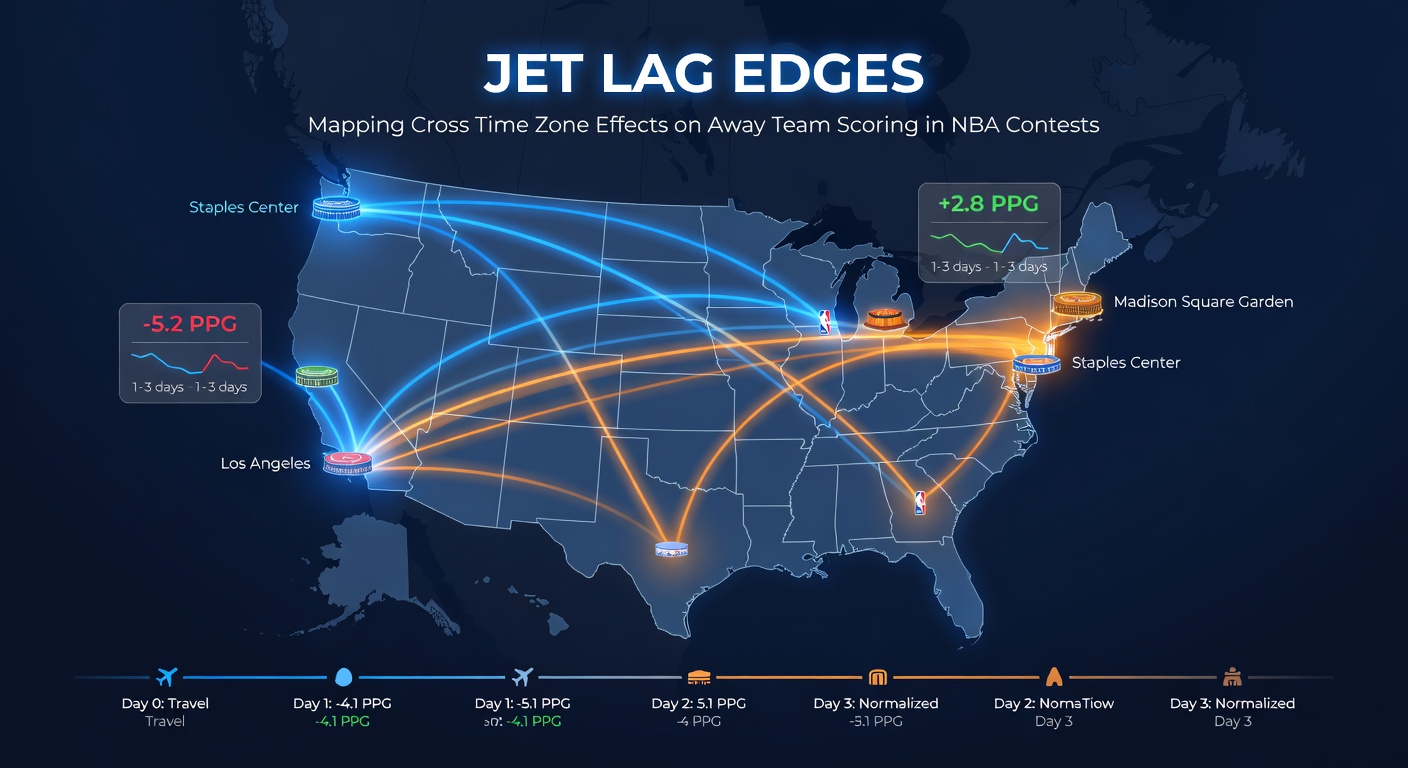
Cross-country travel in the NBA creates measurable shifts in away team scoring output, particularly when teams cross multiple time zones. Researchers tracking game data since the 2010s have documented consistent patterns where teams traveling westward often post lower point totals in the first half, while eastward trips correlate with different recovery timelines. These effects stem from circadian rhythm disruptions that influence shooting accuracy and defensive rotations rather than overall effort levels.
Time Zone Differences and Travel Direction
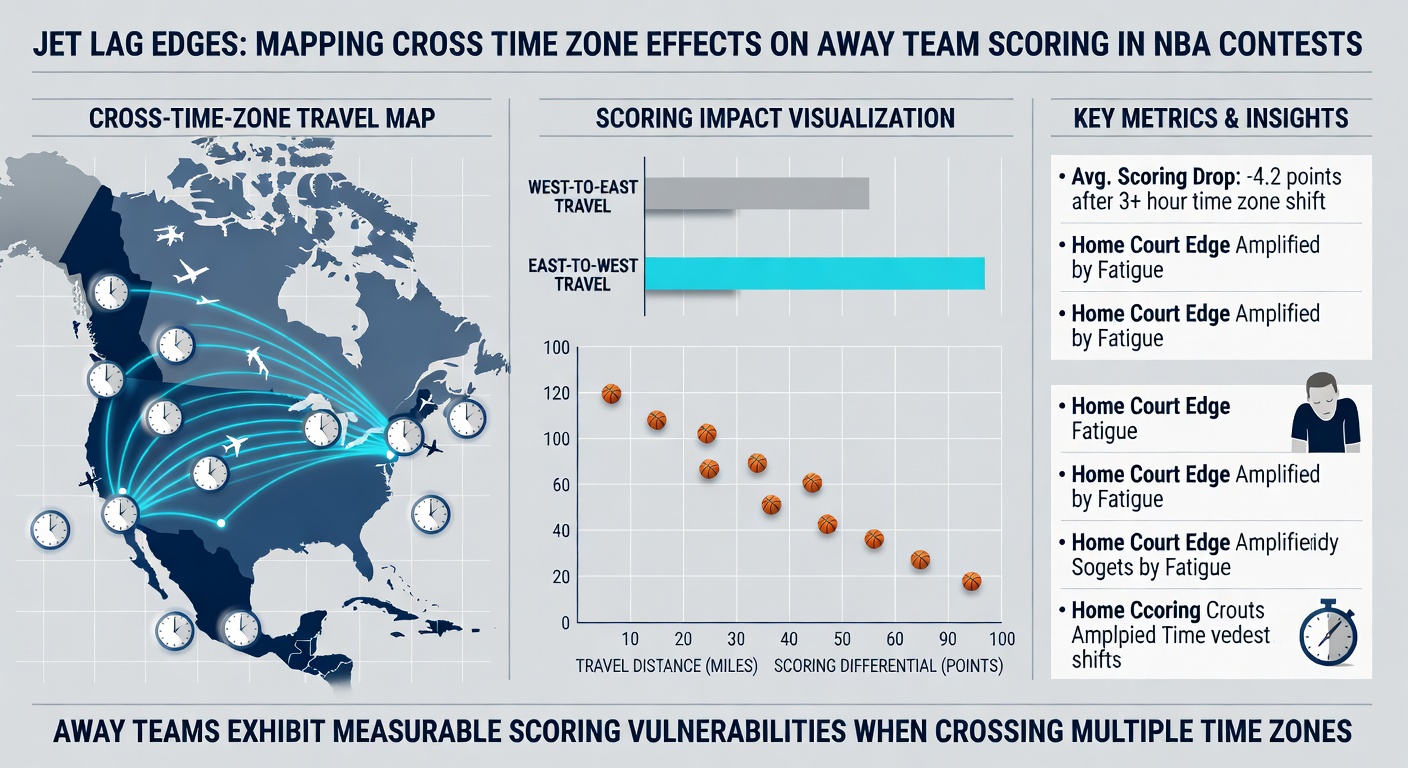
Teams based on the West Coast face a three-hour shift when playing on the East Coast, whereas East Coast squads encounter a similar adjustment heading west. Data compiled across multiple seasons indicates that westward travel tends to reduce away team scoring by an average of four to six points per game in the initial 24 hours after arrival. Eastward flights show a milder impact, with scoring dips averaging two to three points but extending into the second game of a back-to-back set. Observers note that these variations appear most pronounced during November through February when the schedule packs in more cross-country flights.
Studies examining player biometric data reveal that core body temperature and reaction times adjust at different rates depending on travel direction. Westward movement aligns more closely with natural sleep cycles for some athletes, yet the overall volume of games played under these conditions produces the documented scoring gaps. League schedules released for the 2025-26 season include 82 regular-season contests per team, with roughly 40 percent involving time zone changes of two hours or more.
Scoring Metrics Across Conference Matchups
Statistical breakdowns separate inter-conference games from intra-conference ones to isolate jet lag variables. When Western Conference teams visit Eastern Conference venues, away scoring averages drop to 108.7 points compared with 114.2 points in same-zone contests, according to aggregated box score records. The reverse matchup shows Eastern teams averaging 110.4 points on the road against Western opponents. These figures hold after controlling for rest days and opponent defensive ratings.
Three-point shooting percentages follow similar trends. Away teams crossing three time zones convert 34.8 percent of attempts in the first 48 hours post-travel, down from a season-long 37.1 percent mark. Mid-range and paint scoring remain steadier, suggesting perimeter efficiency suffers more from disrupted sleep patterns. Analysts reviewing play-by-play logs have identified longer defensive closeouts and increased turnovers in transition as contributing factors during the first quarter of such games.
Recovery Windows and Schedule Density
Recovery timelines vary by the number of time zones crossed and the density of upcoming fixtures. Teams with at least 48 hours between arrival and tip-off show scoring outputs that return to baseline levels, while 24-hour turnarounds retain measurable deficits. The 2025-26 schedule features several instances of three-game road trips spanning four time zones, creating extended periods where cumulative effects compound. League medical staff track sleep metrics through wearable devices, and aggregated reports indicate that players require between three and five days to fully realign internal clocks after a three-zone shift.
Back-to-back sets amplify the initial travel impact. Second games of such sets see away teams averaging an additional 3.2-point reduction when the first contest involved a westward flight. Researchers from institutions monitoring athlete performance have noted that afternoon tip times partially mitigate these effects compared with evening games, likely because they reduce the overlap between peak fatigue periods and game action.
Regional Patterns and Venue Specifics
Coastal venues host the majority of cross-zone matchups, yet inland arenas also register distinct scoring profiles. Data from games in Denver and Salt Lake City, which sit at higher elevations, combine altitude factors with time zone adjustments to produce the largest observed scoring gaps. Away teams in these locations average 105.9 points when arriving from the Eastern Time Zone, the lowest mark across all venue groupings. Coastal West Coast arenas show smaller gaps once teams have one full day to adjust.
Playoff scheduling adds another layer. The 2026 postseason begins in mid-April, with potential conference finals extending into late May. Teams advancing through multiple rounds often face repeated time zone crossings within short windows, and historical data from prior postseasons shows away scoring in later rounds declining further when series shift across zones. Conference finals in May 2026 could feature several such series depending on final seeding outcomes.
Conclusion
Mapping these travel effects relies on large datasets that separate jet lag influences from other variables such as opponent strength and rest. Consistent patterns emerge across regular season and postseason contests, with directional travel and recovery windows serving as primary predictors of scoring shifts. Teams and analysts continue to incorporate these metrics into preparation protocols, while schedule makers evaluate ways to reduce extreme crossings during high-density periods. The resulting performance data provides a clear record of how time zone changes shape outcomes in NBA contests.